Home
1-kinh-te-quan-ly
1-luan-an-tot-nghiep
phat-trien-du-lich
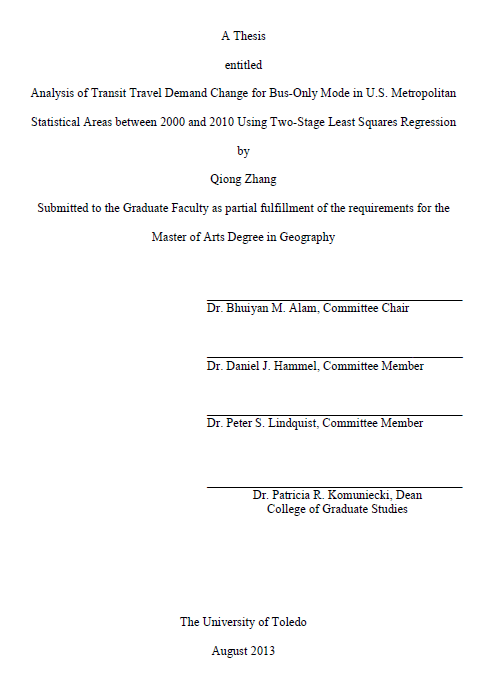
Analysis of transit travel demand change for bus-only mode in U.S. metropolitan statistical areas between 2000 and 2010 using two-stage least squares regression
Analysis of transit travel demand change for bus-only mode in U.S. metropolitan statistical areas between 2000 and 2010 using two-stage least squares regression
Analysis of transit travel demand change for bus-only mode in U.S. metropolitan statistical areas between 2000 and 2010 using two-stage least squares regression
Table of Contents
Abstract
Acknowledgements
Table of Contents
List of Tables
List of Figures
List of Abbreviations
List of Symbols
1 Introduction
1.1 Background
1.2 Statement of the Problem
1.3 Rational of the Research
1.4 Objectives of the Research
1.4.1 General Objective
1.4.2 Specific Objective
1.5 Research Hypotheses
1.5.1 First Stage
1.5.2 Second Stage
1.6 Scope of the Study
1.7 Limitations of the Study
2 Literature Review
2.1 Debate regarding the Transit Analysis Areas
2.1.1 Single City Studies
2.1.2 Multiple Cities Studies
2.1.3 Multiple Cities Studies
2.1.3.1 Urbanized Areas
2.1.3.2 Metropolitan Statistical Areas
2.2 Methodology
2.2.1 Descriptive Approach
2.2.2 Causal Approach
2.2.3 Two-Stage Least Square Regression
2.3 Factors Impacting Transit Ridership
2.3.1 External Factors
2.3.2 Internal Factors
2.3.3 Emotional Factors
2.4 Implications of Reviewed Literature
3 Research Methodology
3.1 Study Area
3.1.1 Standards of Definition in 2000
3.1.2 Standards of Definition in 2010
3.2 Conceptual Diagram of Transit Demand Analysis
3.3 Data Sources
3.4 Variables
3.4.1 Explanation of Choice of Independent Variables
3.4.2 Explanation of Dependent Variables
3.5 Two-Stage Least Square Regression
3.5.1 First Stage
3.5.2 Second Stage
3.6 Regression Pitfalls and Solution
3.6.1 Multicollinearity
3.6.2 Missing Values
3.7 Research Design
3.8 Expected Results
4 Results and Analysis
4.1 2000 Results
4.1.1 2000 VIF Results
4.1.2 First Stage Results for 2000
4.1.3 Second Stage Results for 2000
4.2 2010 Results
4.2.1 2010 VIF Results
4.2.2 First Stage Results for 2000
4.2.3 Second Stage Results for 2000
4.3 Discussion
4.3.1 Comparison of 2000 and 2010 Models’ Results
4.3.2 Explanation for Each Variable’s Impact on Service Demand
5 Conclusion
5.1 Overview
5.2 Conclusions and Research Implication
5.3 Limitations and Future Research
References
A Transit Pattern Survey
B Toledo MSA Sprawling Index Calculation
C MSAs Used as Study Area Bài viết liên quan
Giá Bán:0.000 VNĐ
Giá Bán:0.000 VNĐ


